Hypertension is a major contributor to cardiovascular morbidity and mortality worldwide, more so in Kenya, with limited progress towards achieving Africa's 2030 fast-track hypertension targets, especially in management. This study aimed to build a machine learning model to predict hypertension medication uptake in Kenya. Using data from 4,687 female and 5,269 male respondents from the 2022 Kenya Demographic and Health Survey, we applied Extreme Gradient Boosting, Support Vector Machine, Random Forest, and Elastic Net models. Data from 15 counties were split into training (80%) and testing (20%) sets, with class imbalance addressed using the Synthetic Minority Oversampling Technique and validation through leave-one-county-out cross-validation. The best-performing model, based on mean f1-score, was retrained using features selected through Sequential Forward Floating Selection. SHapley Additive exPlanations were used to interpret feature importance and directionality by sex. Treatment coverage remained suboptimal, with 26.6% of hypertensive males and 32.4% of females untreated. The XGBoost model achieved the best performance (78% males; 81% females). The most predictive features in both sexes were age, household size, sedentary time, income, exercise, wealth, residence duration, television viewership, and reproductive preferences among females. Interpretable machine learning revealed distinct sex-specific socio-behavioural predictors of hypertension treatment uptake in Kenya. Incorporating such data-driven insights can inform targeted, equitable interventions and strengthen hypertension control, especially in resource-limited settings where routine survey data can complement clinical assessments.
| Published in | Biomedical Statistics and Informatics (Volume 11, Issue 2) |
| DOI | 10.11648/j.bsi.20261102.11 |
| Page(s) | 40-59 |
| Creative Commons |
This is an Open Access article, distributed under the terms of the Creative Commons Attribution 4.0 International License (http://creativecommons.org/licenses/by/4.0/), which permits unrestricted use, distribution and reproduction in any medium or format, provided the original work is properly cited. |
| Copyright |
Copyright © The Author(s), 2026. Published by Science Publishing Group |
Hypertension, Medication Uptake, Socio-behavioural Factors, Machine Learning, Predictive Modelling
Pre-processing step | Females | Males |
|---|---|---|
Total available variables | 5930 | 564 |
More than 30% missing | 5355 | 303 |
Constant or duplicate columns | 150 | 11 |
Non-informative (low variance) | 98 | 15 |
Above 0.8 correlated features | 50 | 22 |
Total excluded | 5653 | 351 |
Final variables | 277 | 213 |
Characteristics | Levels | Overall | Hypertension awareness | ||
|---|---|---|---|---|---|
Females | Males | Females | Males | ||
n (Total number of individuals,%) | 5,269 | 4,687 | 534 (10.1) | 229 (4.9) | |
County, n (%) | Baringo | 359 | 314 | 29 (8.1) | 13 (4.1) |
Embu | 296 | 305 | 30 (10.1) | 19 (6.2) | |
Homa Bay | 374 | 271 | 37 (9.9) | 18 (6.6) | |
Kilifi | 393 | 344 | 25 (6.4) | 12 (3.5) | |
Laikipia | 300 | 259 | 43 (14.3) | 14 (5.4) | |
Meru | 299 | 325 | 33 (11.0) | 17 (5.2) | |
Migori | 403 | 313 | 31 (7.7) | 15 (4.8) | |
Mombasa | 393 | 390 | 42 (10.7) | 18 (4.6) | |
Nairobi | 484 | 374 | 51 (10.5) | 17 (4.5) | |
Nyamira | 327 | 264 | 21 (6.4) | 14 (5.3) | |
Nyandarua | 323 | 275 | 38 (11.8) | 16 (5.8) | |
Nyeri | 275 | 289 | 38 (13.8) | 16 (5.5) | |
Tharaka-Nithi | 264 | 297 | 41 (15.5) | 11 (3.7) | |
Uasin Gishu | 391 | 355 | 44 (11.3) | 11 (3.1) | |
Vihiga | 388 | 312 | 31 (8.0) | 18 (5.8) | |
Characteristics | Levels | Males on medication | Females on medication | ||||
|---|---|---|---|---|---|---|---|
Total No. | Yes | No | Total No. | Yes | No | ||
n (Total number of individuals,%) | Overall | 229 | 168 (73.4) | 61 (26.6) | 534 | 361 (67.6) | 173 (32.4) |
County, n (%) | Baringo | 13 | 10 (76.9) | 3 (23.1) | 29 | 20 (69.0) | 9 (31.0) |
Embu | 19 | 16 (84.2) | 3 (15.8) | 30 | 17 (56.7) | 13 (43.3) | |
Homa Bay | 18 | 15 (83.3) | 3 (16.7) | 37 | 28 (75.7) | 9 (24.3) | |
Kilifi | 12 | 6 (50.0) | 6 (50.0) | 25 | 15 (60.0) | 10 (40.0) | |
Laikipia | 14 | 10 (71.4) | 4 (28.6) | 43 | 27 (62.8) | 16 (37.2) | |
Meru | 17 | 12 (70.6) | 5 (29.4) | 33 | 25 (75.8) | 8 (24.2) | |
Migori | 15 | 11 (73.3) | 4 (26.7) | 31 | 13 (41.9) | 18 (58.1) | |
Mombasa | 18 | 12 (66.7) | 6 (33.3) | 42 | 26 (61.9) | 16 (38.1) | |
Nairobi | 17 | 10 (58.8) | 7 (41.2) | 51 | 30 (58.8) | 21 (41.2) | |
Nyamira | 14 | 11 (78.6) | 3 (21.4) | 21 | 13 (61.9) | 8 (38.1) | |
Nyandarua | 16 | 13 (81.2) | 3 (18.8) | 38 | 31 (81.6) | 7 (18.4) | |
Nyeri | 16 | 12 (75.0) | 4 (25.0) | 38 | 28 (73.7) | 10 (26.3) | |
Tharaka-Nithi | 11 | 9 (81.8) | 2 (18.2) | 41 | 30 (73.2) | 11 (26.8) | |
Uasin Gishu | 11 | 8 (72.7) | 3 (27.3) | 44 | 33 (75.0) | 11 (25.0) | |
Vihiga | 18 | 13 (72.2) | 5 (27.8) | 31 | 25 (80.6) | 6 (19.4) | |
Model | Train F1 | Train Recall | Train Precision | Test F1 | Test Recall | Test Precision | LOOC F1 | LOOC Recall | LOOC Precision |
|---|---|---|---|---|---|---|---|---|---|
males XGB | 78.69 | 94.13 | 67.78 | 75.98 | 90.31 | 65.76 | 82.63 | 93.41 | 74.95 |
females XGB | 81.43 | 97.04 | 70.21 | 80.42 | 96.23 | 69.07 | 79.87 | 97.76 | 68.16 |
males RF | 79.91 | 87.11 | 74.15 | 75.53 | 85.00 | 68.07 | 81.31 | 88.48 | 76.52 |
females RF | 83.55 | 96.47 | 73.77 | 80.67 | 96.49 | 69.33 | 78.51 | 96.19 | 67.13 |
male SVM | 79.90 | 90.54 | 73.25 | 76.26 | 90.95 | 66.19 | 81.25 | 90.79 | 75.24 |
females SVM | 82.56 | 80.62 | 84.78 | 78.31 | 86.47 | 71.61 | 69.60 | 75.23 | 66.65 |
males EN | 68.60 | 65.13 | 73.01 | 70.16 | 70.13 | 70.29 | 70.33 | 65.57 | 78.40 |
females EN | 69.47 | 65.24 | 74.61 | 68.31 | 64.95 | 72.09 | 60.49 | 56.39 | 74.32 |
KDHS | Kenya Demographic and Health Surveys |
EN | Elastic Net |
RF | RandomForest |
SVM | Support Vector Machine |
GAM | Generalized Additive Model |
CVDs | Cardiovascular Diseases |
NCDs | Noncommunicable Diseases |
SFFS | Sequential Forward Floating Selection |
SHAP | SHapley Additive exPlanations |
WHO | World Health Organization |
PR | Precision-Recall |
County | Sex | Train F1 | Train Rec | Train Prec | Test F1 | Test Rec | Test Prec | LOOC F1 | LOOC Rec | LOOC Prec |
|---|---|---|---|---|---|---|---|---|---|---|
Baringo | Males | 78.5 | 95.7 | 66.6 | 76.6 | 94.4 | 64.4 | 87.0 | 100 | 76.9 |
Females | 81.7 | 96.1 | 71.1 | 79.7 | 93.6 | 69.4 | 85.7 | 100 | 75.0 | |
Embu | Males | 77.2 | 89.3 | 68.1 | 77.0 | 86.5 | 69.4 | 81.2 | 81.2 | 81.2 |
Females | 82.4 | 97.5 | 71.5 | 79.8 | 95.7 | 68.4 | 80.0 | 100 | 66.7 | |
Homa Bay | Males | 78.8 | 93.3 | 68.3 | 76.3 | 92.1 | 65.1 | 93.8 | 100 | 88.2 |
Females | 81.3 | 97.0 | 70.0 | 79.4 | 94.6 | 68.4 | 82.1 | 88.9 | 76.2 | |
Kilifi | Males | 79.5 | 97.2 | 67.3 | 75.3 | 91.3 | 64.1 | 66.7 | 100 | 50.0 |
Females | 82.0 | 96.8 | 71.1 | 79.5 | 93.1 | 69.4 | 63.6 | 87.5 | 50.0 | |
Laikipia | Males | 78.1 | 95.7 | 66.1 | 78.9 | 94.5 | 67.7 | 83.3 | 100 | 71.4 |
Females | 81.4 | 98.8 | 69.2 | 81.2 | 98.9 | 68.8 | 83.3 | 100 | 71.4 | |
Meru | Males | 79.6 | 94.7 | 68.8 | 75.3 | 90.0 | 64.8 | 85.7 | 100 | 75.0 |
Females | 81.2 | 97.2 | 69.7 | 81.1 | 97.8 | 69.2 | 90.9 | 100 | 83.3 | |
Migori | Males | 77.5 | 91.4 | 67.3 | 80.2 | 95.6 | 69.0 | 91.7 | 100 | 84.6 |
Females | 82.2 | 98.4 | 70.6 | 81.3 | 97.3 | 69.8 | 62.1 | 100 | 45.0 | |
Mombasa | Males | 81.8 | 90.4 | 75.0 | 61.0 | 63.3 | 58.8 | 69.2 | 75.0 | 64.3 |
Females | 81.5 | 97.4 | 70.1 | 80.8 | 97.8 | 68.8 | 76.4 | 100 | 61.8 | |
Nairobi | Males | 77.8 | 95.2 | 65.9 | 80.0 | 94.5 | 69.4 | 76.9 | 100 | 62.5 |
Females | 80.8 | 94.9 | 70.4 | 79.2 | 91.8 | 69.5 | 78.6 | 100 | 64.7 | |
Nyamira | Males | 78.2 | 94.8 | 66.7 | 77.8 | 95.6 | 65.6 | 81.8 | 81.8 | 81.8 |
Females | 81.2 | 96.6 | 70.1 | 81.4 | 97.9 | 69.7 | 72.0 | 90.0 | 60.0 | |
Nyandarua | Males | 77.8 | 97.1 | 64.9 | 77.7 | 97.8 | 64.4 | 89.7 | 100 | 81.2 |
Females | 80.7 | 97.7 | 68.8 | 81.0 | 97.3 | 69.4 | 90.2 | 100 | 82.1 | |
Nyeri | Males | 78.6 | 93.3 | 68.0 | 71.7 | 78.9 | 65.7 | 80.0 | 83.3 | 76.9 |
Females | 80.7 | 94.9 | 70.3 | 79.8 | 94.6 | 69.0 | 81.0 | 100 | 68.0 | |
Tharaka-Nithi | Males | 79.3 | 95.7 | 67.7 | 76.6 | 93.4 | 64.9 | 90.0 | 100 | 81.8 |
Females | 81.7 | 97.7 | 70.3 | 80.6 | 98.4 | 68.3 | 78.0 | 100 | 64.0 | |
Uasin Gishu | Males | 79.1 | 94.3 | 68.2 | 75.7 | 89.0 | 65.9 | 82.4 | 87.5 | 77.8 |
Females | 81.2 | 97.2 | 69.8 | 82.0 | 99.5 | 69.7 | 85.7 | 100 | 75.0 | |
Vihiga | Males | 78.6 | 93.8 | 67.8 | 79.6 | 97.8 | 67.2 | 80.0 | 92.3 | 70.6 |
Females | 81.5 | 97.4 | 70.1 | 79.5 | 95.1 | 68.2 | 88.4 | 100 | 79.2 |
County | Sex | Train F1 | Train Rec | Train Prec | Test F1 | Test Rec | Test Prec | LOOC F1 | LOOC Rec | LOOC Prec |
|---|---|---|---|---|---|---|---|---|---|---|
Baringo | Males | 79.8 | 86.7 | 74.1 | 74.6 | 86.7 | 65.5 | 73.7 | 70.0 | 77.8 |
Females | 83.1 | 96.6 | 73.0 | 81.2 | 97.9 | 69.3 | 85.7 | 100 | 75.0 | |
Embu | Males | 78.0 | 84.4 | 72.6 | 76.0 | 82.0 | 70.9 | 84.8 | 87.5 | 82.4 |
Females | 83.7 | 97.2 | 73.5 | 81.2 | 96.8 | 70.0 | 74.1 | 100 | 58.8 | |
Homa Bay | Males | 80.5 | 89.8 | 72.9 | 76.2 | 86.5 | 68.1 | 85.7 | 80.0 | 92.3 |
Females | 83.7 | 95.8 | 74.4 | 80.5 | 96.2 | 69.3 | 76.2 | 88.9 | 66.7 | |
Kilifi | Males | 80.8 | 89.7 | 73.8 | 75.7 | 84.8 | 68.4 | 66.7 | 100 | 50.0 |
Females | 83.1 | 94.1 | 74.5 | 80.2 | 94.7 | 69.5 | 66.7 | 100 | 50.0 | |
Laikipia | Males | 80.3 | 86.7 | 75.5 | 73.9 | 82.4 | 67.0 | 90.9 | 100 | 83.3 |
Females | 83.5 | 95.8 | 74.1 | 81.7 | 97.8 | 70.2 | 83.3 | 100 | 71.4 | |
Meru | Males | 79.3 | 84.7 | 75.0 | 72.0 | 75.6 | 68.7 | 85.7 | 100 | 75.0 |
Females | 82.9 | 95.9 | 73.2 | 80.0 | 95.7 | 68.7 | 90.9 | 100 | 83.3 | |
Migori | Males | 79.0 | 86.6 | 73.1 | 77.7 | 90.1 | 68.3 | 88.0 | 100 | 78.6 |
Females | 84.0 | 96.8 | 74.3 | 80.4 | 95.2 | 69.6 | 60.0 | 100 | 42.9 | |
Mombasa | Males | 82.0 | 88.1 | 77.3 | 69.5 | 73.3 | 66.0 | 72.0 | 75.0 | 69.2 |
Females | 83.6 | 96.3 | 73.9 | 80.5 | 96.2 | 69.3 | 74.1 | 95.2 | 60.6 | |
Nairobi | Males | 79.6 | 88.6 | 72.5 | 77.7 | 87.9 | 69.6 | 75.0 | 90.0 | 64.3 |
Females | 83.6 | 96.7 | 73.6 | 80.0 | 94.6 | 69.3 | 80.0 | 100 | 66.7 | |
Nyamira | Males | 79.6 | 88.1 | 73.1 | 77.2 | 86.7 | 69.6 | 78.3 | 81.8 | 75.0 |
Females | 83.9 | 97.9 | 73.3 | 80.7 | 97.9 | 68.7 | 60.9 | 70.0 | 53.8 | |
Nyandarua | Males | 79.0 | 88.5 | 71.5 | 77.5 | 91.0 | 67.5 | 92.9 | 100 | 86.7 |
Females | 84.1 | 97.9 | 73.8 | 79.8 | 95.7 | 68.5 | 90.2 | 100 | 82.1 | |
Nyeri | Males | 80.6 | 87.5 | 75.0 | 72.1 | 78.9 | 66.4 | 80.0 | 83.3 | 76.9 |
Females | 83.7 | 94.9 | 75.0 | 81.0 | 96.2 | 69.9 | 82.1 | 94.1 | 72.7 | |
Tharaka-Nithi | Males | 80.0 | 85.3 | 75.6 | 77.4 | 90.1 | 67.8 | 90.0 | 100 | 81.8 |
Females | 83.2 | 96.8 | 73.1 | 81.6 | 98.9 | 69.4 | 82.1 | 100 | 69.6 | |
Uasin Gishu | Males | 80.3 | 85.8 | 75.5 | 76.4 | 89.0 | 66.9 | 80.0 | 75.0 | 85.7 |
Females | 83.2 | 97.6 | 72.6 | 81.4 | 98.4 | 69.5 | 85.7 | 100 | 75.0 | |
Vihiga | Males | 79.9 | 86.1 | 74.7 | 79.0 | 90.0 | 70.4 | 75.9 | 84.6 | 68.8 |
Females | 84.0 | 96.7 | 74.3 | 79.8 | 95.1 | 68.8 | 85.7 | 94.7 | 78.3 |
County | Sex | Train F1 | Train Rec | Train Prec | Test F1 | Test Rec | Test Prec | LOOC F1 | LOOC Rec | LOOC Prec |
|---|---|---|---|---|---|---|---|---|---|---|
Baringo | Males | 80.8 | 82.4 | 79.9 | 75.6 | 84.4 | 68.5 | 84.2 | 80.0 | 88.9 |
Females | 82.8 | 81.0 | 84.7 | 78.9 | 88.2 | 71.4 | 72.0 | 75.0 | 69.2 | |
Embu | Males | 77.3 | 76.7 | 78.5 | 75.1 | 83.1 | 68.5 | 87.5 | 87.5 | 87.5 |
Females | 83.0 | 81.7 | 84.5 | 80.6 | 88.3 | 74.1 | 83.3 | 100 | 71.4 | |
Homa Bay | Males | 80.1 | 80.2 | 80.4 | 75.9 | 83.1 | 69.8 | 82.8 | 80.0 | 85.7 |
Females | 81.9 | 80.3 | 83.8 | 80.1 | 89.2 | 72.7 | 62.5 | 55.6 | 71.4 | |
Kilifi | Males | 80.7 | 100 | 67.6 | 79.0 | 100 | 65.2 | 66.7 | 100 | 50.0 |
Females | 83.5 | 80.6 | 86.6 | 77.0 | 85.6 | 70.0 | 60.0 | 75.0 | 50.0 | |
Laikipia | Males | 80.2 | 100 | 66.9 | 78.8 | 100 | 65.0 | 83.3 | 100 | 71.4 |
Females | 81.5 | 80.7 | 82.4 | 79.1 | 88.1 | 71.8 | 82.6 | 95.0 | 73.1 | |
Meru | Males | 79.4 | 78.5 | 80.8 | 68.1 | 71.1 | 65.3 | 72.0 | 75.0 | 69.2 |
Females | 83.5 | 82.5 | 84.6 | 76.5 | 83.3 | 70.8 | 61.5 | 53.3 | 72.7 | |
Migori | Males | 83.0 | 81.3 | 85.0 | 75.6 | 83.5 | 69.1 | 80.0 | 72.7 | 88.9 |
Females | 85.0 | 82.6 | 87.5 | 79.3 | 87.8 | 72.4 | 44.4 | 66.7 | 33.3 | |
Mombasa | Males | 81.5 | 79.9 | 84.1 | 69.6 | 71.1 | 68.1 | 66.7 | 66.7 | 66.7 |
Females | 80.6 | 78.3 | 83.2 | 78.7 | 88.1 | 71.2 | 68.0 | 81.0 | 58.6 | |
Nairobi | Males | 80.6 | 100 | 67.6 | 79.1 | 100 | 65.5 | 74.1 | 100 | 58.8 |
Females | 82.0 | 79.9 | 84.3 | 77.5 | 83.2 | 72.5 | 81.6 | 90.9 | 74.1 | |
Nyamira | Males | 78.7 | 100 | 64.9 | 78.3 | 100 | 64.3 | 88.0 | 100 | 78.6 |
Females | 82.8 | 81.0 | 84.9 | 80.0 | 89.4 | 72.4 | 44.4 | 40.0 | 50.0 | |
Nyandarua | Males | 77.6 | 100 | 63.4 | 78.1 | 100 | 64.0 | 89.7 | 100 | 81.2 |
Females | 82.6 | 79.4 | 86.2 | 75.0 | 81.5 | 69.4 | 88.0 | 95.7 | 81.5 | |
Nyeri | Males | 79.2 | 100 | 65.6 | 78.6 | 100 | 64.7 | 85.7 | 100 | 75.0 |
Females | 82.0 | 79.6 | 84.8 | 78.6 | 87.1 | 71.7 | 89.5 | 100 | 81.0 | |
Tharaka-Nithi | Males | 80.6 | 79.1 | 82.2 | 75.1 | 87.9 | 65.6 | 90.0 | 100 | 81.8 |
Females | 82.3 | 81.5 | 83.5 | 76.4 | 83.3 | 70.5 | 54.5 | 56.2 | 52.9 | |
Uasin Gishu | Males | 79.7 | 100 | 66.3 | 78.4 | 100 | 64.5 | 84.2 | 100 | 72.7 |
Females | 83.3 | 80.9 | 86.0 | 77.8 | 86.3 | 70.9 | 71.7 | 70.4 | 73.1 | |
Vihiga | Males | 79.1 | 100 | 65.5 | 78.6 | 100 | 64.7 | 83.9 | 100 | 72.2 |
Females | 81.6 | 79.3 | 84.7 | 79.2 | 87.6 | 72.3 | 80.0 | 73.7 | 87.5 |
County | Sex | Train F1 | Train Rec | Train Prec | Test F1 | Test Rec | Test Prec | LOOC F1 | LOOC Rec | LOOC Prec |
|---|---|---|---|---|---|---|---|---|---|---|
Baringo | Males | 68.1 | 64.4 | 73.1 | 69.3 | 68.9 | 69.7 | 70.6 | 60.0 | 85.7 |
Females | 69.3 | 65.8 | 73.3 | 68.9 | 66.8 | 71.0 | 72.7 | 66.7 | 80.0 | |
Embu | Males | 69.5 | 68.0 | 71.4 | 65.9 | 64.0 | 67.9 | 81.2 | 81.2 | 81.2 |
Females | 72.6 | 69.1 | 76.8 | 66.5 | 62.2 | 71.3 | 77.8 | 70.0 | 87.5 | |
Homa Bay | Males | 66.9 | 66.6 | 67.3 | 72.2 | 73.0 | 71.4 | 81.5 | 73.3 | 91.7 |
Females | 68.8 | 64.4 | 74.1 | 71.0 | 68.1 | 74.1 | 53.8 | 38.9 | 87.5 | |
Kilifi | Males | 68.5 | 63.9 | 74.4 | 69.3 | 67.4 | 71.3 | 61.5 | 66.7 | 57.1 |
Females | 70.1 | 64.5 | 76.8 | 70.1 | 68.1 | 72.3 | 73.7 | 87.5 | 63.6 | |
Laikipia | Males | 69.6 | 65.7 | 74.5 | 72.4 | 73.6 | 71.3 | 76.2 | 80.0 | 72.7 |
Females | 66.6 | 61.2 | 73.4 | 68.1 | 66.5 | 69.9 | 75.0 | 75.0 | 75.0 | |
Meru | Males | 72.1 | 70.3 | 75.2 | 68.2 | 66.7 | 69.8 | 66.7 | 66.7 | 66.7 |
Females | 73.3 | 70.7 | 76.1 | 70.2 | 67.2 | 73.5 | 40.0 | 26.7 | 80.0 | |
Migori | Males | 69.8 | 64.1 | 77.1 | 72.7 | 74.7 | 70.8 | 66.7 | 54.5 | 85.7 |
Females | 70.9 | 64.4 | 79.5 | 69.7 | 65.4 | 74.5 | 43.5 | 55.6 | 35.7 | |
Mombasa | Males | 72.2 | 67.9 | 77.9 | 59.8 | 54.4 | 66.2 | 58.3 | 58.3 | 58.3 |
Females | 68.5 | 65.5 | 72.0 | 71.0 | 68.1 | 74.1 | 51.2 | 52.4 | 50.0 | |
Nairobi | Males | 62.0 | 58.6 | 66.4 | 74.2 | 75.8 | 72.6 | 76.2 | 80.0 | 72.7 |
Females | 66.4 | 62.9 | 70.4 | 63.5 | 57.6 | 70.7 | 71.4 | 68.2 | 75.0 | |
Nyamira | Males | 69.3 | 65.7 | 73.5 | 72.2 | 72.2 | 72.2 | 63.2 | 54.5 | 75.0 |
Females | 69.2 | 65.2 | 73.8 | 68.0 | 64.4 | 72.0 | 33.3 | 20.0 | 100 | |
Nyandarua | Males | 69.2 | 65.1 | 74.0 | 75.6 | 76.4 | 74.7 | 57.1 | 46.2 | 75.0 |
Females | 72.3 | 67.8 | 77.9 | 63.9 | 59.2 | 69.4 | 78.3 | 78.3 | 78.3 | |
Nyeri | Males | 69.0 | 64.6 | 74.2 | 65.2 | 64.4 | 65.9 | 91.7 | 91.7 | 91.7 |
Females | 69.7 | 66.0 | 74.8 | 65.9 | 61.3 | 71.2 | 83.3 | 88.2 | 78.9 | |
Tharaka-Nithi | Males | 68.8 | 65.8 | 72.2 | 73.0 | 75.8 | 70.4 | 70.6 | 66.7 | 75.0 |
Females | 68.7 | 64.0 | 74.4 | 67.4 | 64.0 | 71.3 | 36.4 | 25.0 | 66.7 | |
Uasin Gishu | Males | 64.2 | 60.4 | 69.4 | 71.7 | 72.5 | 71.0 | 66.7 | 50.0 | 100 |
Females | 68.6 | 64.9 | 72.7 | 72.4 | 71.0 | 73.9 | 52.4 | 40.7 | 73.3 | |
Vihiga | Males | 69.8 | 65.9 | 74.6 | 70.7 | 72.2 | 69.1 | 66.7 | 53.8 | 87.5 |
Females | 67.0 | 62.2 | 73.2 | 68.0 | 64.3 | 72.1 | 64.5 | 52.6 | 83.3 |
| [1] | K. T. Mills, A. Stefanescu, and J. He, ‘The global epidemiology of hypertension’, Nat. Rev. Nephrol., vol. 16, no. 4, pp. 223–237, 2020, |
| [2] |
WHO, ‘Hypertension Kenya 2023 country profile’, Technical document, 2023. Accessed: Nov. 28, 2024. Available:
https://www.who.int/publications/m/item/hypertension-ken-2023-country-profile |
| [3] | Of M. (US) C. on P. H. P. to R. and C. Hypertension, ‘Interventions Directed at Individuals with Hypertension’, in A Population-Based Policy and Systems Change Approach to Prevent and Control Hypertension, National Academies Press (US), 2010. Accessed: Feb. 21, 2026. Available: |
| [4] | S. F. Mohamed et al., ‘Prevalence, awareness, treatment and control of hypertension and their determinants: results from a national survey in Kenya’, BMC Public Health, vol. 18, no. 3, p. 1219, 2018, |
| [5] | R. Kurniawan et al., ‘Hypertension prediction using machine learning algorithm among Indonesian adults’, IAES Int. J. Artif. Intell. IJ-AI, vol. 12, no. 2, pp. 776–784, 2023, |
| [6] | V. Visco et al., ‘Artificial Intelligence in Hypertension Management: An Ace up Your Sleeve’, J. Cardiovasc. Dev. Dis., vol. 10, no. 2, p. 74, Feb. 2023, |
| [7] | J. A. M. Sidey-Gibbons and C. J. Sidey-Gibbons, ‘Machine learning in medicine: a practical introduction’, BMC Med. Res. Methodol., vol. 19, no. 1, p. 64, Dec. 2019, |
| [8] | M. M. Alsaleh et al., ‘Prediction of disease comorbidity using explainable artificial intelligence and machine learning techniques: A systematic review’, Int. J. Med. Inf., vol. 175, p. 105088, 2023, |
| [9] | Md. M. Islam et al., ‘Predicting the risk of hypertension using machine learning algorithms: A cross sectional study in Ethiopia’, PLOS ONE, vol. 18, no. 8, p. e0289613, 2023, |
| [10] | S. M. S. Islam et al., ‘Machine Learning Approaches for Predicting Hypertension and Its Associated Factors Using Population-Level Data From Three South Asian Countries’, Front. Cardiovasc. Med., vol. 9, 2022, |
| [11] |
DHS, ‘The DHS Program - Kenya: Standard DHS’. Accessed: Apr. 05, 2026. Available:
https://dhsprogram.com/methodology/survey/survey-display-566.cfm |
| [12] | M. Kuhn and K. Johnson, Feature Engineering and Selection: A Practical Approach for Predictive Models. New York: Chapman and Hall/CRC, 2019. |
| [13] | S. van Buuren and K. Groothuis-Oudshoorn, ‘mice: Multivariate Imputation by Chained Equations in R’, J. Stat. Softw., vol. 45, pp. 1–67, 2011, |
| [14] | T. Chen and C. Guestrin, ‘XGBoost: A Scalable Tree Boosting System’, in Proceedings of the 22nd ACM SIGKDD International Conference on Knowledge Discovery and Data Mining, in KDD ’16. New York, NY, USA: Association for Computing Machinery, 2016, pp. 785–794. |
| [15] | C. Cortes and V. Vapnik, ‘Support-vector networks’, Mach. Learn., vol. 20, no. 3, pp. 273–297, Sep. 1995, |
| [16] |
‘The random forest algorithm for statistical learning’. Accessed: May 05, 2026. Available:
https://journals.sagepub.com/doi/epub/10.1177/1536867X20909688 |
| [17] | ‘(PDF) Random Forest Algorithm Overview’, ResearchGate, May 2026, |
| [18] | C. Goutte and E. Gaussier, ‘A Probabilistic Interpretation of Precision, Recall and F-Score, with Implication for Evaluation’, in Advances in Information Retrieval, D. E. Losada and J. M. Fernández-Luna, Eds, Berlin, Heidelberg: Springer, 2005, pp. 345–359. |
| [19] | T. Saito and M. Rehmsmeier, ‘The Precision-Recall Plot Is More Informative than the ROC Plot When Evaluating Binary Classifiers on Imbalanced Datasets’, PLOS ONE, vol. 10, no. 3, p. e0118432, 2015, |
| [20] | P. Pudil, J. Novovičová, and J. Kittler, ‘Floating search methods in feature selection’, Pattern Recognit. Lett., vol. 15, no. 11, pp. 1119–1125, 1994, |
| [21] | W. Shahin, G. A. Kennedy, and I. Stupans, ‘The association between social support and medication adherence in patients with hypertension: A systematic review’, Pharm. Pract., vol. 19, no. 2, p. 2300, 2021, |
| [22] | E. Sarkodie, D. K. Afriyie, A. Hutton-Nyameaye, and S. K. Amponsah, ‘Adherence to drug therapy among hypertensive patients attending two district hospitals in Ghana’, Afr. Health Sci., vol. 20, no. 3, pp. 1355–1367, Sep. 2020, |
| [23] | A. Ungar and G. Rivasi, ‘Increasing awareness on frailty in the management of hypertensive older adults’, J. Hypertens., vol. 38, no. 11, p. 2148, 2020, |
| [24] | A. Fiuza-Luces et al., ‘Exercise benefits in cardiovascular disease: beyond attenuation of traditional risk factors’, Nat. Rev. Cardiol., vol. 15, no. 12, pp. 731–743, 2018, |
| [25] | H. Ahrensberg, C. Bjørk Petersen, J. N. W. Jacobsen, M. Toftager, and A. Ernest Bauman, ‘The Descriptive Epidemiology of Sedentary Behaviour’, in Sedentary Behaviour Epidemiology, M. F. Leitzmann, C. Jochem, and D. Schmid, Eds, Cham: Springer International Publishing, 2023, pp. 45–80. |
| [26] | A. Wondmieneh, G. Gedefaw, A. Getie, and A. Demis, ‘Self-Care Practice and Associated Factors among Hypertensive Patients in Ethiopia: A Systematic Review and Meta-Analysis’, Int. J. Hypertens., vol. 2021, no. 1, p. 5582547, 2021, |
| [27] | S. Kimani, W. Mirie, M. Chege, O. T. Okube, and S. Muniu, ‘Association of lifestyle modification and pharmacological adherence on blood pressure control among patients with hypertension at Kenyatta National Hospital, Kenya: a cross-sectional study’, BMJ Open, vol. 9, no. 1, p. e023995, 2019, |
| [28] | D. R. Hanna, J. A. Campbell, R. J. Walker, A. Z. Dawson, and L. E. Egede, ‘Association between Health and Wealth among Kenyan Adults with Hypertension’, Glob. J. Health Sci., vol. 13, no. 4, pp. 86–94, 2021, |
| [29] | R. Oyando, E. Barasa, and J. E. Ataguba, ‘Socioeconomic Inequity in the Screening and Treatment of Hypertension in Kenya: Evidence From a National Survey’, Front. Health Serv., vol. 2, 2022, |
| [30] | R. Oyando et al., ‘Patient costs of hypertension care in public health care facilities in Kenya’, Int. J. Health Plann. Manage., vol. 34, no. 2, pp. e1166–e1178, 2019, |
APA Style
Koech, E., Mutai, C. K., Kerich, G. (2026). Predicting Hypertension Medication Uptake Using Explainable Artificial Intelligence: Evidence from a Kenyan Population-based Study. Biomedical Statistics and Informatics, 11(2), 40-59. https://doi.org/10.11648/j.bsi.20261102.11
ACS Style
Koech, E.; Mutai, C. K.; Kerich, G. Predicting Hypertension Medication Uptake Using Explainable Artificial Intelligence: Evidence from a Kenyan Population-based Study. Biomed. Stat. Inform. 2026, 11(2), 40-59. doi: 10.11648/j.bsi.20261102.11
@article{10.11648/j.bsi.20261102.11,
  author = {Eliud Koech and Charles Kipkoech Mutai and Gregory Kerich},
  title = {Predicting Hypertension Medication Uptake Using Explainable Artificial Intelligence: Evidence from a Kenyan Population-based Study},
  journal = {Biomedical Statistics and Informatics},
  volume = {11},
  number = {2},
  pages = {40-59},
  doi = {10.11648/j.bsi.20261102.11},
  url = {https://doi.org/10.11648/j.bsi.20261102.11},
  eprint = {https://article.sciencepublishinggroup.com/pdf/10.11648.j.bsi.20261102.11},
  abstract = {Hypertension is a major contributor to cardiovascular morbidity and mortality worldwide, more so in Kenya, with limited progress towards achieving Africa's 2030 fast-track hypertension targets, especially in management. This study aimed to build a machine learning model to predict hypertension medication uptake in Kenya. Using data from 4,687 female and 5,269 male respondents from the 2022 Kenya Demographic and Health Survey, we applied Extreme Gradient Boosting, Support Vector Machine, Random Forest, and Elastic Net models. Data from 15 counties were split into training (80%) and testing (20%) sets, with class imbalance addressed using the Synthetic Minority Oversampling Technique and validation through leave-one-county-out cross-validation. The best-performing model, based on mean f1-score, was retrained using features selected through Sequential Forward Floating Selection. SHapley Additive exPlanations were used to interpret feature importance and directionality by sex. Treatment coverage remained suboptimal, with 26.6% of hypertensive males and 32.4% of females untreated. The XGBoost model achieved the best performance (78% males; 81% females). The most predictive features in both sexes were age, household size, sedentary time, income, exercise, wealth, residence duration, television viewership, and reproductive preferences among females. Interpretable machine learning revealed distinct sex-specific socio-behavioural predictors of hypertension treatment uptake in Kenya. Incorporating such data-driven insights can inform targeted, equitable interventions and strengthen hypertension control, especially in resource-limited settings where routine survey data can complement clinical assessments.},
 year = {2026}
}
TY  - JOUR
T1  - Predicting Hypertension Medication Uptake Using Explainable Artificial Intelligence: Evidence from a Kenyan Population-based Study
AU  - Eliud Koech
AU  - Charles Kipkoech Mutai
AU  - Gregory Kerich
Y1  - 2026/06/02
PY  - 2026
N1  - https://doi.org/10.11648/j.bsi.20261102.11
DO  - 10.11648/j.bsi.20261102.11
T2  - Biomedical Statistics and Informatics
JF  - Biomedical Statistics and Informatics
JO  - Biomedical Statistics and Informatics
SP  - 40
EP  - 59
PB  - Science Publishing Group
SN  - 2578-8728
UR  - https://doi.org/10.11648/j.bsi.20261102.11
AB  - Hypertension is a major contributor to cardiovascular morbidity and mortality worldwide, more so in Kenya, with limited progress towards achieving Africa's 2030 fast-track hypertension targets, especially in management. This study aimed to build a machine learning model to predict hypertension medication uptake in Kenya. Using data from 4,687 female and 5,269 male respondents from the 2022 Kenya Demographic and Health Survey, we applied Extreme Gradient Boosting, Support Vector Machine, Random Forest, and Elastic Net models. Data from 15 counties were split into training (80%) and testing (20%) sets, with class imbalance addressed using the Synthetic Minority Oversampling Technique and validation through leave-one-county-out cross-validation. The best-performing model, based on mean f1-score, was retrained using features selected through Sequential Forward Floating Selection. SHapley Additive exPlanations were used to interpret feature importance and directionality by sex. Treatment coverage remained suboptimal, with 26.6% of hypertensive males and 32.4% of females untreated. The XGBoost model achieved the best performance (78% males; 81% females). The most predictive features in both sexes were age, household size, sedentary time, income, exercise, wealth, residence duration, television viewership, and reproductive preferences among females. Interpretable machine learning revealed distinct sex-specific socio-behavioural predictors of hypertension treatment uptake in Kenya. Incorporating such data-driven insights can inform targeted, equitable interventions and strengthen hypertension control, especially in resource-limited settings where routine survey data can complement clinical assessments.
VL  - 11
IS  - 2
ER  -
Department of Mathematics, Physics, and Computer Science, Alupe University, Busia, Kenya;Department of Mathematics, Physics and Computing, Moi University, Eldoret, Kenya
Department of Mathematics, Physics and Computing, Moi University, Eldoret, Kenya
Department of Mathematics, Physics and Computing, Moi University, Eldoret, Kenya
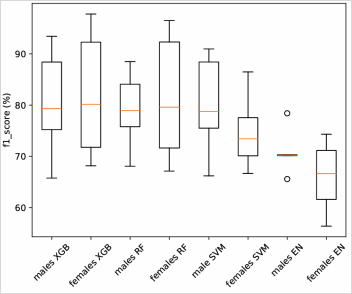
Figure 1. Box plots for model performance measured by f1-score in leave-one-out and test samples.
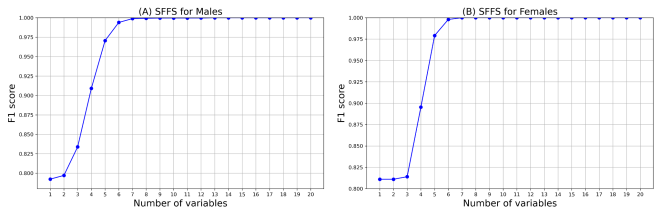
Figure 2. Variable selection from SFFS (A: Males, B: Females).
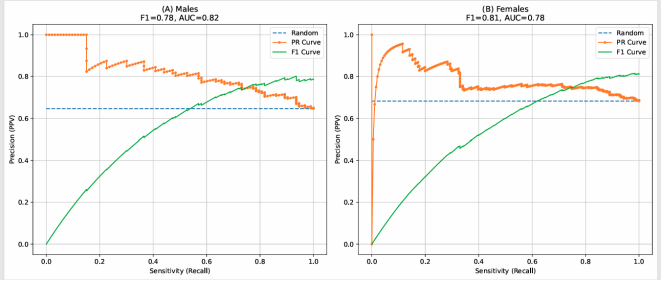
Figure 3. Precision–Recall (PR) curves illustrating the performance of the final model: (A) males and (B) females.
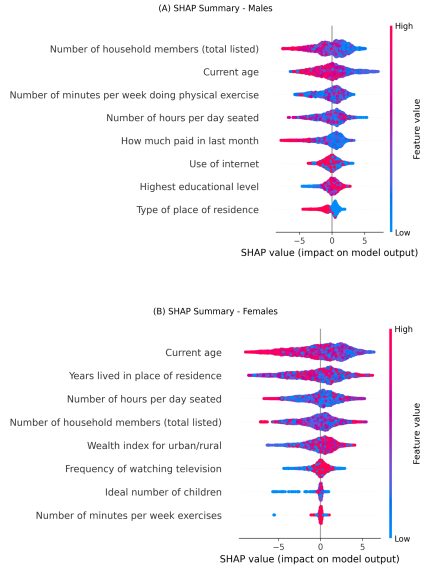
Figure 4. SHAP value plots for direction of associations (A: males, B: females; red indicates positive, blue indicates negative).
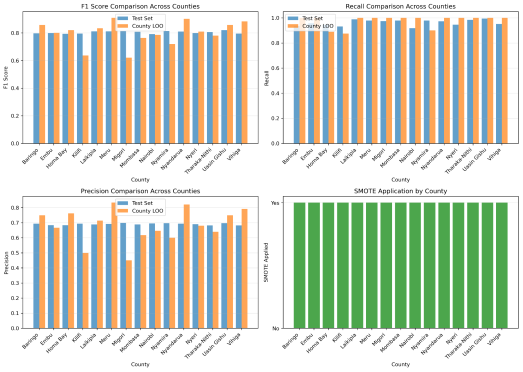
Figure 5. XGBoost in Females.
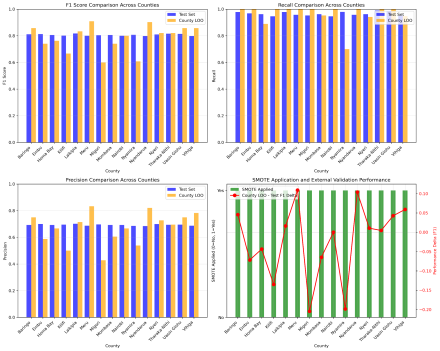
Figure 6. Random Forest in Females.
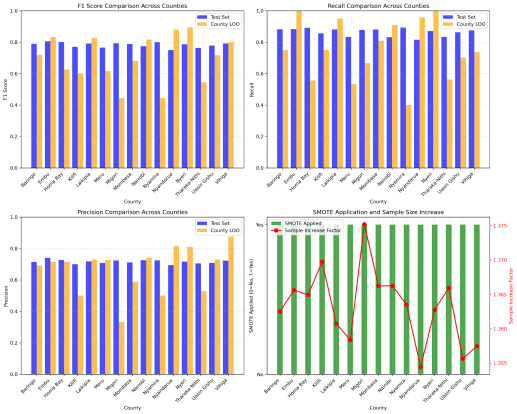
Figure 7. Support Vector Machine in Females.
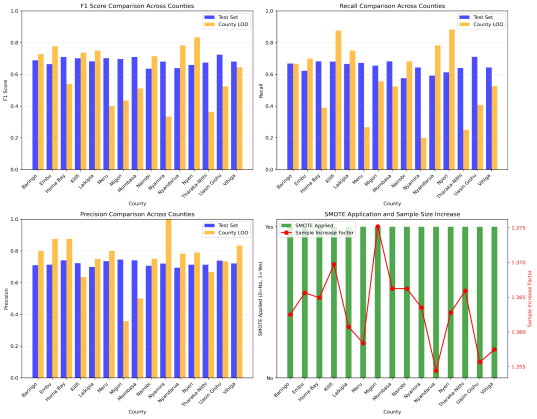
Figure 8. ElasticNet in Females.
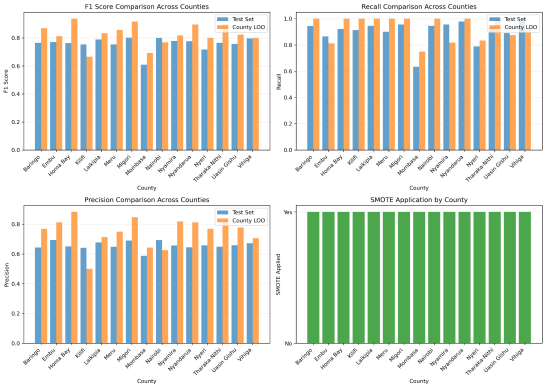
Figure 9. XGBoost in Males.
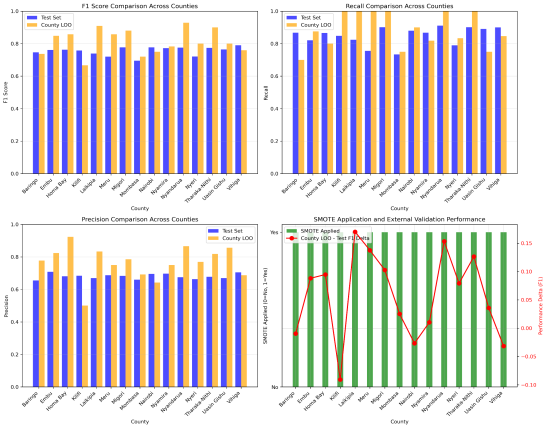
Figure 10. Random Forest in Males.
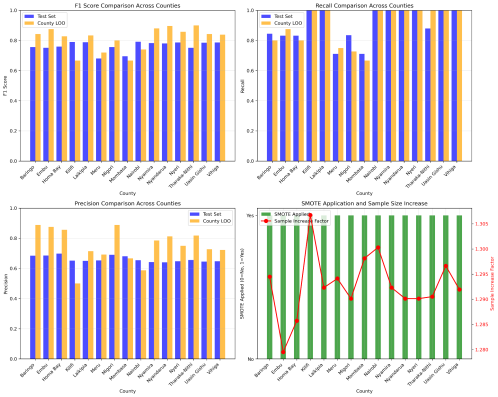
Figure 11. Support Vector Machine in Males.
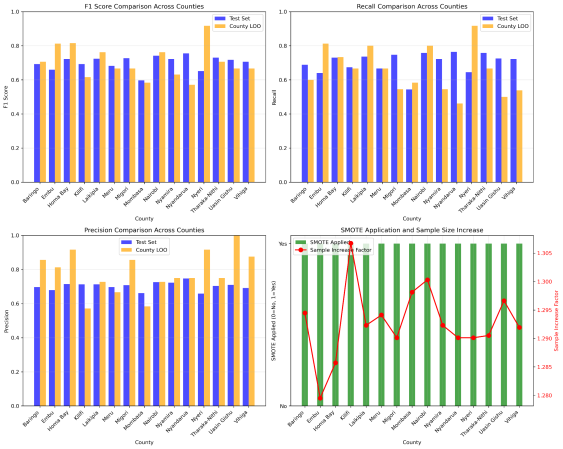
Figure 12. ElasticNet in Males.
Information